Showing posts with label Market Trend and Analysis. Show all posts

Thursday, 27 March 2014

Market Trend and Types


What is Market Trend?

Market Trend can be defined as the overall direction of trading in the broader market on either a short- mid- or long-term basis. A trend that moves generally higher is called an uptrend, and one that moves generally lower is called a downtrend.Trends can be short- or long-term. Short term trends cycle within the broader trend, sometimes moving with it and sometimes against it. Many issues affect rises and falls in share prices, whether gradual changes or sharp spikes. The best way to understand how the market fluctuates is to study trends.


Significance of Market Trend


We all have seen how a Stock Trader buys numerous shares of a hot stock or dumps shares of a stock that has crashed or is at point of plunge. We also have seen TV commercials of many Brokerage Firms that claim to have exciting prospects and ventures and strong portfolios. And also perhaps we also have researched about a hundred different ways to predict the rise and fall of the stock market.


But the main question of how these Traders and Broker Firms predict when to buy or sell the shares, remains partially solved I would say. The truth is there is no magical or short cut way to predict the stock market behavior. There are numerous issues affect rises and falls in share prices, whether moderate changes or sharp spikes. The best way to understand how the market fluctuates is to study the market trends carefully. By recognizing a trend in the stock market or in an individual stock, we will be able to choose the best times to buy and sell.


Market Mentalities - 


Before analysis of Market Trend, we must be aware of the different Market Mentalities . Market Trends can be classified into Primary & Secondary Market Trend and Secular Market Trend


Primary Market Trends - 

A primary trend has broad support throughout the entire market (most sectors) and lasts for a year or more duration of time. Primary Market Trend can be sub-classified into Bull Market Trend & Bear Market Trend.

  • Bull Market - 

Bull markets are characterized by sheer optimism, investor confidence and expectations that strong results will continue. 

A Bull Market is when the market appears to be in a long-term climb. Bull markets tend to develop when the economy is strong, the unemployment rate is low, and inflation is under control. The emotional and psychological state of investors also affects the market. For example, if investors have faith that the upward trend in stock prices will continue, they are likely to buy more stocks. If there are more buyers interested in buying shares at a given price than there are sellers who are willing to part with their shares at that price, stock prices will continue to rise. 


  • Bear Market -  
Bear Markets are characterized by sheer pessimism. investor skepticism and uncertainty.

A Bear Market describes a market that appears to be in a long-term decline. Bear markets tend to develop when the economy enters a recession period, unemployment rate is high, and inflation is rising. Investors lose faith in the market as a whole, which in turn decreases the demand for stocks. Keep in mind that a sustained bear market is something that you should expect to occur from time to time, and that, in the past, the stock market has risen more than it has declined.


Secondary Market Trends

Secondary trends are short-term changes in price direction within a primary trend. The duration is a few weeks or a few months.  The two types of Secondary Market Trends are Correction and Bear Market Rally.

  • Correction - 

A market correction is a secondary or short-term stock market trend where stock prices fall 5-20% over a relatively short period of time, such as a few weeks or up to several months. Corrections are generally temporary price declines interrupting an uptrend in the market (or an asset). A correction has a shorter duration than a bear market or a recession, but it can be a progenitor to either. 

Note: A bear market should not be confused with correction, which is a short-term trend that has a duration of less than two months. While corrections are often a great place for a value investor to find an entry point, bear markets rarely provide great entry points, as timing the bottom is very difficult to do.

Application - Some investors may perceive a correction as a good time to buy more shares of stocks at relatively lower prices before the bull market trend resumes. However, other investors may detect this as a new and prolonged downward trend which will continue into a full bear market trend and reduce their exposure to stocks or stock mutual funds.

  • Bear Market Rally - 


A bear market rally is a sharp move up in the context of a larger bear market. It is actually a period in which prices of stocks increase during a bear market. A bear market rally is usually a short-lived market increase following a period of market decline and is followed by another period of market decline leading to a highly down trend. Bear market rallies occurred in the Dow Jones index after the 1929 stock market crash leading down to the market bottom in 1932, and throughout the late 1960's and early 1970's. Although there are no official guidelines for a bear market rally, it is sometimes defined as an overall market increase of 10-20% during an overall bear market. 

Secular Market Trends

A secular market trend is a long-term trend that lasts 5 to 25 years and consists of a series of primary trends. A secular bear market consists of smaller bull markets and larger bear markets; a secular bull market consists of larger bull markets and smaller bear markets.Secular markets are typically driven by large-scale national and worldwide events, which occur in combination. For example, wars, demographic/population shifts and governmental/political policies are all events that could drive secular markets.


Types of Market Trends - 

The direction of the trend is absolutely essential to trading and analyzing the market.


Types of Trends
The chart depicts Upward Trend (Rise in Value)

      Types of Trends
The chart depicts Downward Trend (Fall in Value)


The chart depicts Sideways Trend (Neither Rise nor Fall)

Market Trend Classification

The chart depicts the different Trade classifications 


Thank You !

Market Trend Analysis


What is Market Trend Analysis?


An aspect of technical analysis that tries to predict the future movement of a stock based on past data. Trend analysis is based on the idea that what has happened in the past gives traders an idea of what will happen in the future. 


Trend Analysis and Timing

Market trends are the upward or downward movement of a market, during a period of time. The direction of any market at any given time is either Bullish (Up), Bearish (Down), or Neutral (Sideways). " Markets move in waves", and in order to make money, a trader must catch the wave at the right time. 


Understanding the Trendlines


Drawing Trendlines


The chart depicts a Trendline being drawn from left of the chart to the right from the highest price peak to lower price thus displaying a Bearish Outlook


Trendlines I


The chart here shows a trendline being drawn from left to right but the prices have been broken and not exactly collinear and are also closed above it. this phase indicates the beginning of new trend


Trendlines II

The chart depicts the possible buying areas for Traders by the help of Trendline supporting boundaries


Channel Lines

When prices remain within two parallel Trendlines they form a Channel. When prices hit the bottom trendline this may be used as a buying area. Similarly, when prices hit the upper trendline this may be used as a selling area. So, channel lines helps traders a great deal in decision making. Waves or Patterns should be carefully noticed while doing analysis. 


Channel Lines


Support Trend Line 


Support Level is a price level where the price tends to find support as it is going down. Buying interest is strong enough to overcome Selling interest, keeping prices at a uninterrupted level.


Resistance Trend Line

resistance level is the opposite of a support level. It is where the price tends to find resistance as it is going up. Selling Interest overcomes Buying interest. 

The following chart depicts the Support Trend Line and Resistance Trend Line 


File:OracleSupportResistanceTrendLineChart.JPG


Conclusion


So, Trend analysis examines data to determine if certain actions or reactions occur in a Patterned Market Trend. Trend analysis helps traders and analysts in a different way as they attempt to make predictions about Market Direction and Price Movements. But all works good when you have the right quality of Data Feed into the Analysis Platform. If quality of real time data feed is not up to mark then the analysis becomes more or less insignificant and highly risky. There are many Real Time Data Service Providers in the country but very few are among them who really maintains quality standard. Some companies like Rtdsdata.com are very good when it comes to maintaining quality standard. Besides the fact of real time data, there is also another factor of Data Recoverability that plays a vital role as well in analysis. Lost Data or Gaps in data will act as a barrier towards effective analysis. Such vital factor should not be neglected and thus Service Providers like Rtdsdata.com are gradually becoming very popular when it comes to maintaining parameters like Quality, Data Recoverability, Prompt Technical Support. So traders will have to be very cautious while choosing the right Data Service Provider.


Thank You !

Saturday, 22 March 2014

Future Market


 What is Futures Market? 


The Futures Market is a centralized marketplace for buyers and sellers from around the world who meet and enter into futures contracts. Pricing can be based on an open cry system, or bids and offers can be matched electronically. The futures contract will state the price that will be paid and the date of delivery. 


Basics of Future Market- 

  • A commodity futures contract is an agreement to buy or sell a particular commodity at a future date
  • The price and the amount of the commodity are fixed at the time of the agreement
  • Most contracts contemplate that the agreement will be fulfilled by actual delivery of the commodity


Typical Users of the Futures Markets - 


  • Most participants in the futures markets are commercial or institutional commodities producers or consumers
  • Most participants are “Hedgers” who trade futures to maximize the value of their assets, and to reduce the risk of financial losses from price changes
  • Other participants are “Speculators” who intends to profit from price changes in futures contracts

Example of Future Contracts

Suppose, we decide to subscribe to cable Internet. As the buyer, we enter into an agreement with the cable company to receive a particular plan of cable internet at a certain price every month for the next year. This contract made with the cable company is similar to a futures contract, in that you have agreed to receive a product at a future date, with the price and terms for delivery already set. We have secured your price for now and the next year - even if the price of cable internet plan rises during that time. By entering into this agreement with the cable company, we have reduced your risk of higher prices. 


Significance of the Futures Market 

Futures Market have a great significance on the economy of a nation like - 

  • Price Discovery - Due to its highly competitive nature, the futures market has become an important economic tool to determine prices based on today's and tomorrow's estimated amount of supply and demand. Factors such as weather, war, debt default, refugee displacement, and deforestation can all have a major effect on supply and demand and, as a result, the present and future price of a commodity. 

  • Risk Reduction - Futures markets are also a place for people to reduce risk when making purchases. Risks are reduced because the price is pre-set, therefore letting participants know how much they will need to buy or sell. This helps reduce the ultimate cost to the retail buyer because with less risk there is less of a chance that manufacturers will jack up prices to make up for profit losses in the cash market. 

Conclusion


The Futures Markets on which they are based have a great effect on economies around the world. Changes in commodity prices can affect entire segments of an economy, and these changes can in turn spur political action (in the form of subsidies, tax changes, or other policy shifts) and social action (in the form of substitution, innovation, or other supply-and-demand activity). So, Future Markets is very significant.


Thank You !

Market Breadth


What is Market breadth? 


Market breadth is a ratio that compares the total number of rising stocks to the total number of falling stocks.


How it works/Example? 

Market breadth, or stock-market breadth, is used in technical analysis to measure the general direction of the stock market based on all traded stocks. Market breadth divides the number of stocks that have experienced gains by the number of stocks that have experienced losses.


  • A ratio greater than one (Market Breadth > 1) indicates overall stock market gains or a bullish sentiment. 


  • By contrast, ratios less than one (Market Breadth < 1) indicate overall losses or a bearish sentiment.


Example of Market Breadth


For example, suppose that on a given business day, 1,500 stocks experience gains and 1,300 stocks experience losses. The market breadth for that day would be expressed as follows:


1500 Rising Stocks/1300 Falling Stocks = 1.153

With a market breadth of 1.153, the stock market would be said to have experienced overall gains.


Significance of Market Breadth


Market Breadth tells you immediately the strength and direction of a move in the market. A market in which more stocks are going up compared to going down and more stocks making new high compared to new low is a good bull market. Extreme Breadth is often indicator of exhaustion and such zones lead to reversal. Tops and bottoms are also formed due to breadth divergence. If a move keeps going up but breadth does not increase then that is divergence. Such divergences typically result in failure of the move.


Market depth


What is Market Depth? 


  • Market depth lists all buy and sell orders in the market for a particular security. It is measured in the ability to support relatively large market orders without much affecting the price of the security. 
  • The market depth is split into those wanting to buy and those wanting to sell. It’s then further broken down into the prices that those buyers and sellers are willing to buy or sell at. 


Significance of Market Depth - 


  • Both traders and investors look at market depth to examine the different prices and volumes (bid and ask volumes) of orders accumulating below and above the market bid and ask prices. Securities with good depth will be relatively liquid, and large orders will not affect price significantly.


  • On the other hand, securities with poor depth are more likely to have their price affected by large orders to buy and sell.


  • Market Depth provides traders with a measure of the number of pending buy and sell orders for a currency pairing at a range of different market prices. 


  • Depth of Market provides traders with information regarding of the amount of liquidity available at different market prices. The larger the volume of buy and sell orders at each price, the greater depth the market is said to have. Depth of Market is often referred to as the order book, due to the fact Depth of Market data shows the current pending orders for a currency or security. Depth of Market data is usually available from exchange for a fixed fee; however those trading Forex may be able to make use of Tier II Depth of Market data straight from their brokerage.


Uses of Market Depth Data - 


  • Scalping: Some traders who use scalping strategies use Depth of Market data to help them determine when they should enter in and out of positions. Depth of Market data is particularly useful to those who scalp as technical indicators and candlestick charts tend to be less reliable over shorter time frames. Very few traders base their short term trading decisions solely on Depth Market data, and instead use depth of market data alongside technical analysis and other trading tools. 


  • Feel out the Market: Seeing Market Depth allows the trader to see order flow from the brokerages perspective, which offers traders with a unique look at the markets directional bias. Traders can keep an eye on order flow and begin to get a general feel of where the market might be headed.


  • Large Volume Traders: Depth of Market data is also useful for those who are trading larger volume as it allows them to see how much liquidity there is at each price level. VWAP (Volume Weighted Average Price) depth of market functionality is particularly useful for those who are placing very large trades as it allows them to see expected entry price instead of the quoted spot price. The majority of retail traders will find enough liquidity for their needs at every price level, but being able to see liquidity levels is still useful.


Thank You !

Friday, 21 March 2014

Market liquidity


What is Market Liquidity? 


  • In Business, Economics or InvestmentMarket Liquidity is an asset's ability to be sold without causing a significant movement in the price and with minimum loss of value. Money, or cash in hand, is the most liquid asset, and can be used immediately to perform actions like buying, selling for goods and services, or paying debt, meeting immediate wants and needs.


  • A market may be considered highly liquid if there are ready and willing buyers and sellers in large quantities. This is related to the concept of Market Depth that can be measured as the units that can be sold or bought for a given price. The opposite concept is that of Market Breadth measured as the price change per unit of liquidity.


What is Liquidation?


An act of exchange of a less liquid asset with a more liquid asset is called LiquidationLiquidity also refers both to a business's ability to meet its payment obligations, in terms of possessing sufficient liquid assets, and to such assets themselves. A liquid asset is something that can easily be converted into cash. An illiquid asset is something like a house, it is worth money, but takes time to be sold and converted into cash. 


Key Contributors to Market Liquidity - 


Speculators and market makers are key contributors to the liquidity of a market, or asset. Speculators and market makers are individuals or institutions that seek to profit from anticipated increases or decreases in a particular market price. By doing this, they provide the capital needed to facilitate the liquidity.

Forms of Liquid Market - 

  • Future Markets - In the Futures Markets, there is no assurance that a liquid market may exist for counteract a commodity contract at all times. Some future contracts and specific delivery months tend to have increasingly more trading activity and have higher liquidity than other contracts. The most useful indicator of liquidity for these contracts is the trading volume.
  • Banking - In banking, liquidity is the ability to meet obligations when they come due without incurring unacceptable losses. Managing liquidity is a daily process requiring bankers to monitor and project cash flows and financial statements to ensure adequate liquidity is maintained. Maintaining a balance between short-term assets and short-term liabilities is vital For an individual bank, clients' deposits are its primary liabilities (in the sense that the bank have to give back all client deposits on demand), whereas reserves and loans are its primary assets (in the sense that these loans are owed to the bank)

Thank You !

Thursday, 20 March 2014

Market Leverage


What is Market Leverage? 


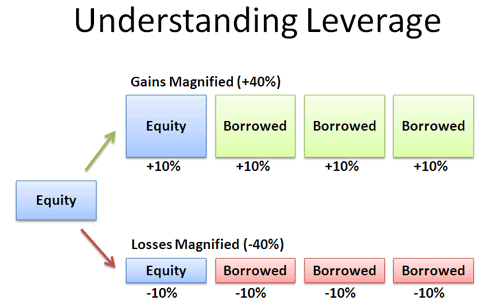
  • Leverage is any technique that amplifies investor profits or losses. It describes use of borrowed money to magnify profit potential (financial leverage), but it can also describe the use of fixed assets to achieve the same goal (operating leverage). 


  • Leverage is the ability to trade a large position (i.e. a large number of shares, or contracts) with only a small amount of trading capital (i.e. margin). 


  • Leverage is the amount of debt used to finance a firm's assets. A firm with significantly more debt than equity is considered to be highly leveraged.

                                                         
Significance of Leverage - 

- Positive Significance

  • Leverage helps both the investor and the company to invest. However, it comes with greater risk as well . If an investor uses leverage to make an investment and the investment moves against the investor, his losses can be much greater than it would've been if the investment had not been leveraged -leverage amplifies both profits and losses. In the business world, a company can use leverage to try to generate shareholder wealth, but if it fails to do so, the interest expense and credit risk of default destroys shareholder value.

Negative Significance - 


  • Leverage is actually a very efficient use of trading capital, and is valued by professional traders because it allows them to trade larger positions (i.e. more contracts, or shares, etc.) with less trading capital. Leverage does not change the potential profit or loss that a trade can make. Rather, it reduces the amount of trading capital that must be used, thereby releasing trading capital for other trades. For example, a trader that wanted to buy a thousand shares of stock at Rs 500 per share would only require perhaps Rs 200,000 of trading capital, thereby leaving the remaining Rs 3,00,000 available for additional trades. This is the way that a professional trader looks at leverage, and is therefore the correct way.


  • Leverage can be of high risk because it magnifies the potential profit or loss that a trade can make (e.g. a one can enter a trade using Rs 100,000 of trading capital, but has the potential to lose Rs 10,00,000 of trading capital). This is because that if a trader has Rs 100,000 of trading capital, he should not be able to lose more than Rs 100,000, and therefore should only be able to trade Rs 100,000 (e.g. by buying one thousand shares of stock at Rs 100 per share). Leverage would allow the same Rs 100,000 of trading capital to trade perhaps Rs 4,00,000 worth of stock (e.g. by buying four thousand shares of stock at Rs 100 per share), which would all be at risk. 


Conclusion


The bottom line is when it comes to leverage, unless you are a professional trader and your losses will be covered by your employer, leveraged investing should probably not be our primary investment strategy. If we are not a professional and you choose to use leverage, it makes sense not to invest more than you can afford to lose. Also, be sure to conduct careful research and make sensible decisions. 


Thank You !